In This Article
In This Article
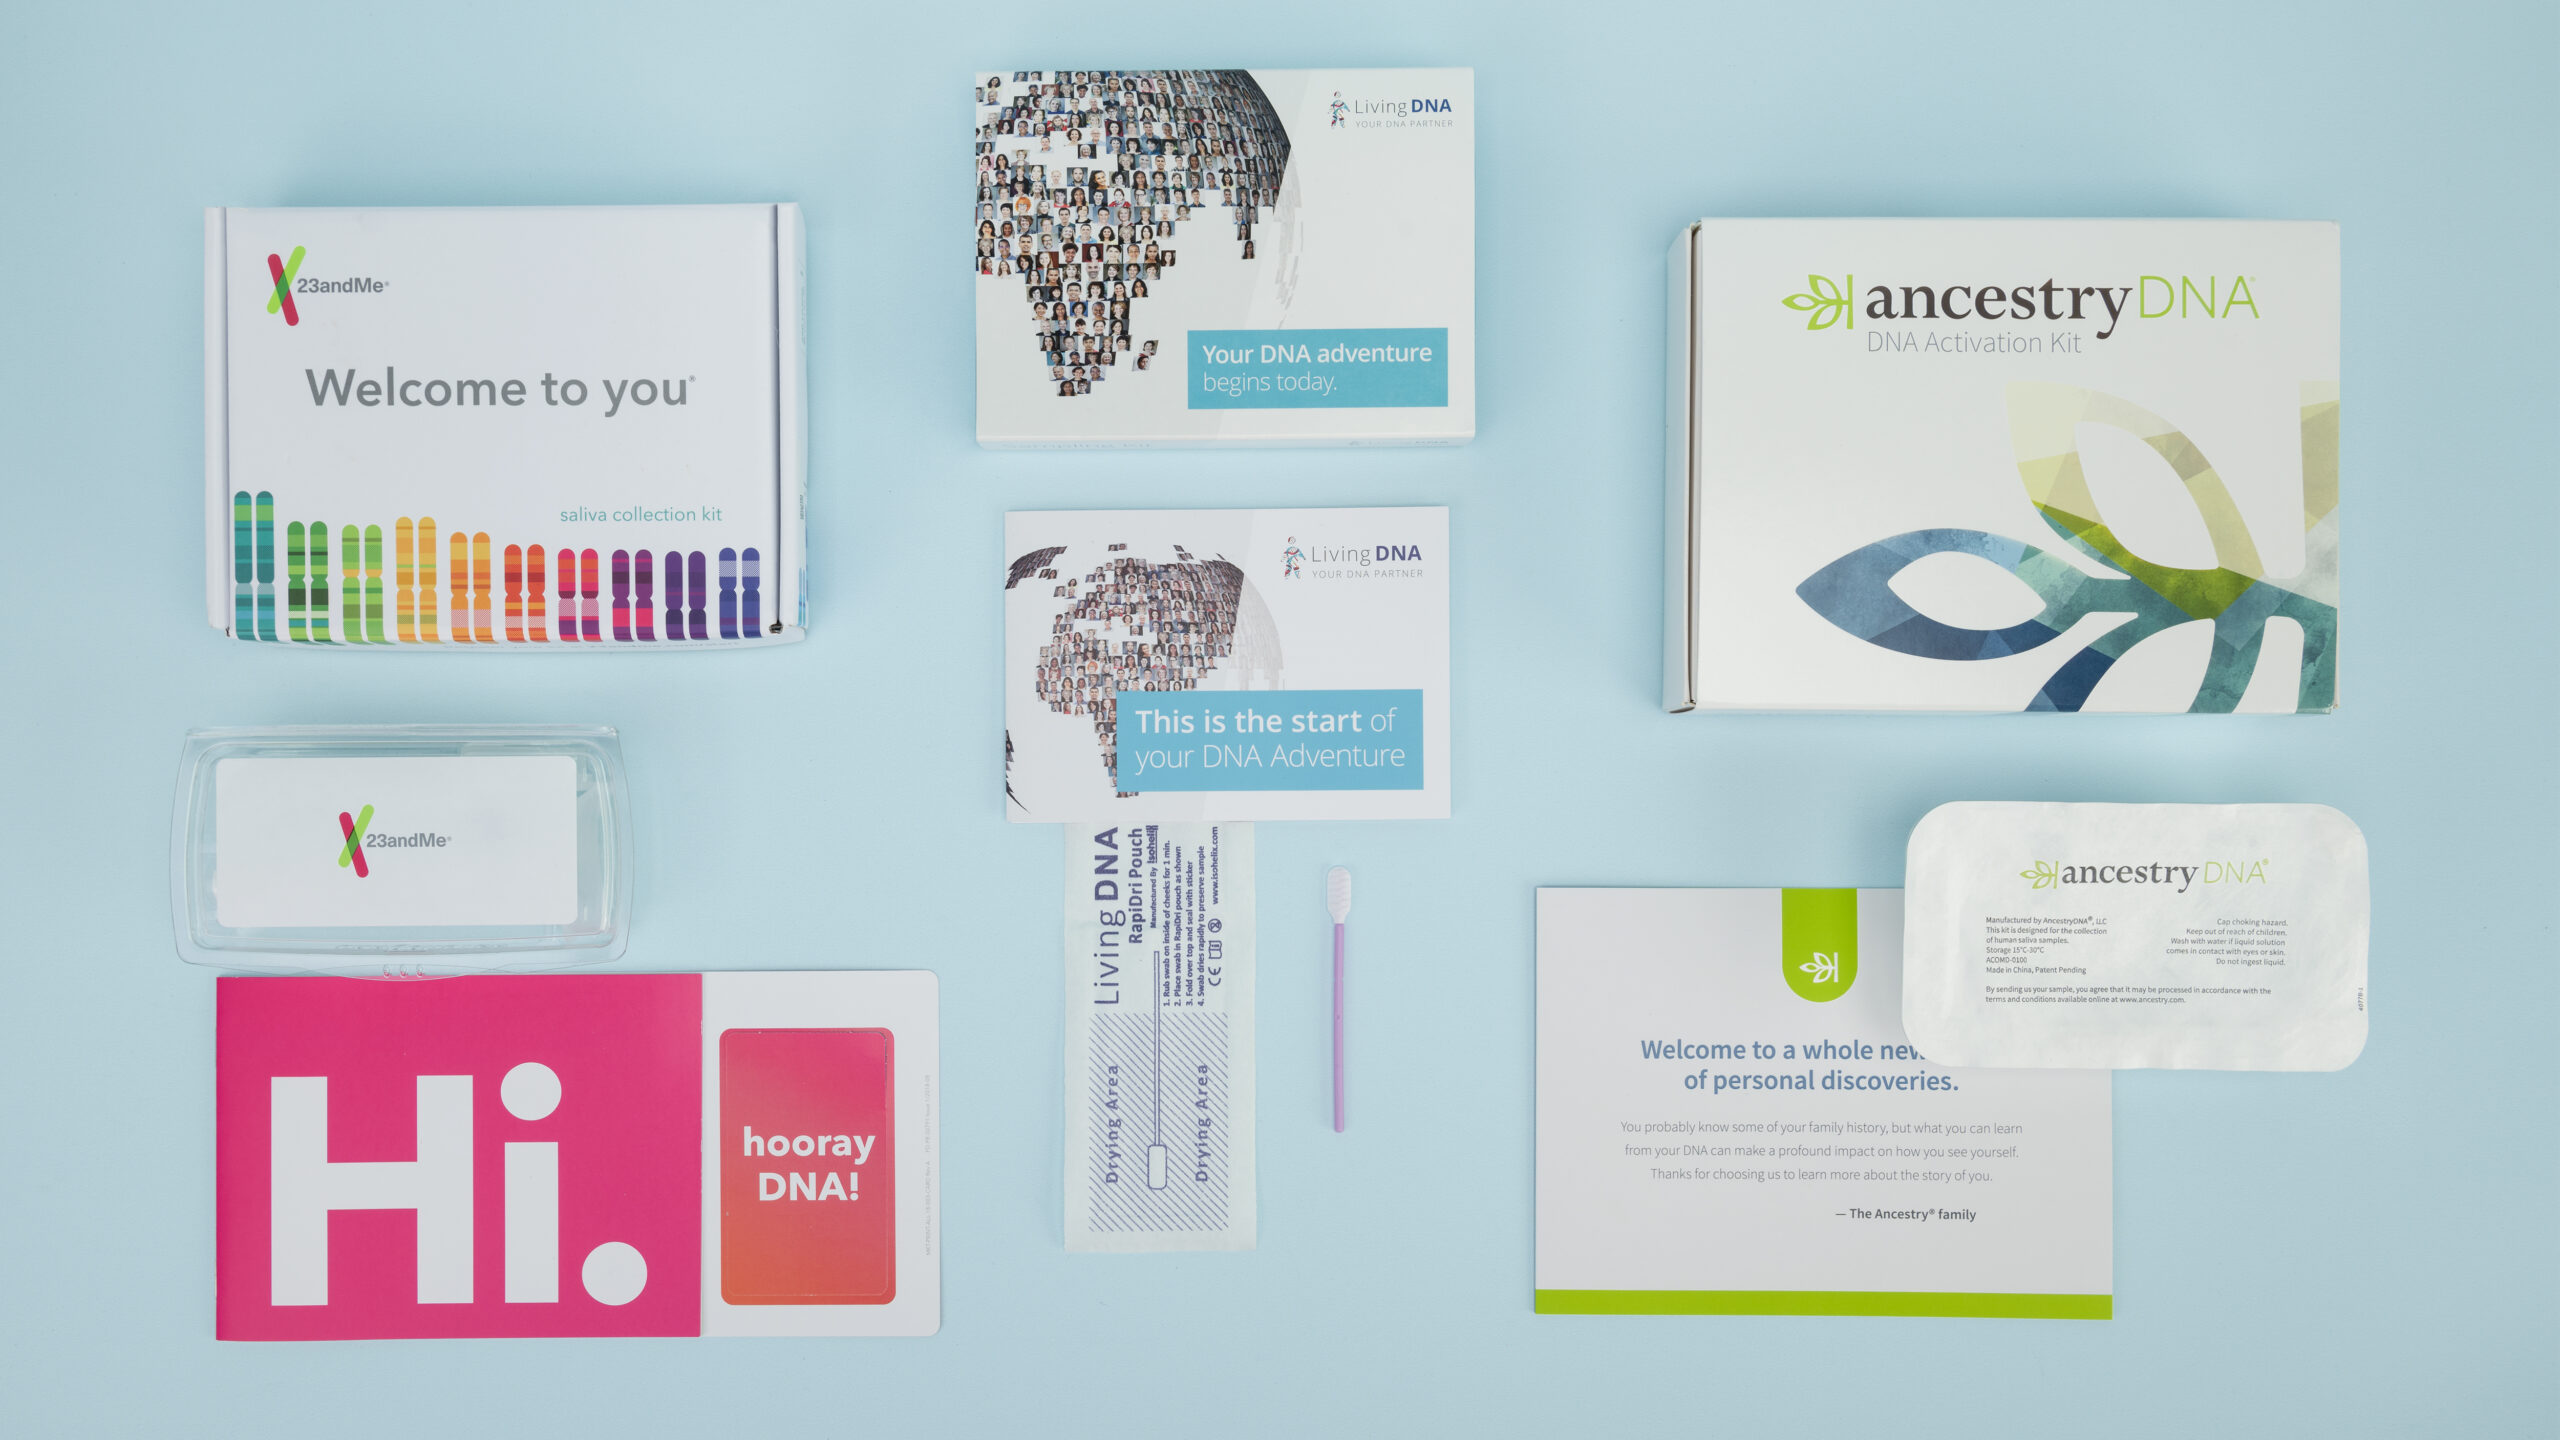
A home DNA kit can turn cheek-swab cells into a time-travel map of your family’s past.
Here’s how scientists read the code hidden in those cells to pinpoint the regions your ancestors once called home.

Know Your DNA Reviews

Don't miss out on the opportunity to learn more about yourself. Read our best DNA test page to find the best one for you.
Every bit of your genome comes from countless forebears.
During recombination—a shuffle that mixes parental chromosomes like a deck of cards—segments swap places. That shuffle means each child gets a new blend of ancestral pieces.
A single-nucleotide polymorphism (SNP) is a one-letter spelling change in DNA.
When certain SNP versions cluster in a region, they act like dialect words that hint at where that DNA strand first spread.
Microarray chips scan roughly 300 000–1 500 000 SNPs in a single run. More markers sharpen resolution much like adding pixels sharpens a photo.
For example, 23andMe’s kit checks about 600 000 SNPs, while MyHeritage’s latest chip reads ≈1.5 million.
| Company | SNPs Scanned | Regions Reported | Sample Type |
| AncestryDNA | ≈300 000 | 3 100+ | Saliva |
| 23andMe | ≈600 000 | 2 000+ | Saliva |
| MyHeritage | ≈1 500 000 | 2 100+ | Cheek swab |
More markers and regions can reveal finer location details.
A reference panel is like a hometown yearbook. Each member can trace all four grandparents to the same place, creating a clean regional DNA snapshot.
Companies recruit thousands from under-represented areas to fill gaps—especially outside Europe, where data have long been sparse.
Once your raw data land in the lab, a three-step recipe runs:
Many firms use machine-learning filters that learn with every new sample, so your numbers update over time.
Numbers like 38% Punjabi or 1% Finnish express probability, not certainty.
“Trace” amounts below 2% can be distant ancestors, shared ancient DNA, or simple statistical noise. Treat them as clues, not proof.
Your DNA never changes, yet one site may label you 40% South Asian while another says 35%.
Differences stem from marker selection, panel makeup, regional definitions, and algorithm tweaks. Our deep dive on DNA-report accuracy explains the validation steps each lab takes.
Ethnicity estimates grow sharper as databases diversify and math improves, but no test can pinpoint a village or replace family-tree research.
Curious how DNA distance is measured? Explore centimorgans to see how scientists infer relationships. For a primer on how genes differ from alleles (gene versions), read our plain-language guide on alleles.
Before sharing raw data, review our overview of privacy in DNA testing to stay safe.
A DNA test opens the first door to your past. Pair those percentages with oral histories, documents, and continued database updates for a fuller picture. If questions arise—especially health-related—consult a genetic counselor for personalized insight.
Know Your DNA Reviews

Looking for a DNA test that's accurate and can tell you about your health and heritage?
